Wednesday, March 29, 2017

How to choose your stock and how to play it

Choosing a stock is just like choosing the one who will be with you until you grow old. Choose wisely choose the best. Choose the one that will make your heart race the fastest. In stocks choose the fastest horse.

There are several strategies we can choose from in choosing a stock.

1. Ticker. This is where I check which stocks are in demand and which stocks are active on that day. I use col check for the first 15-30 minutes trade. List the stocks that are unusual and isn't heard of. After that I look for the charts on my list. You can check where the stock is coming from. If this is an illiquid stock and is on a squeeze in a bollinger then you will say that someone is accumulating it. You can either accumulate at the lows or buy the support.


The rectangle part is an example of a squeezed bollinger. And the one with the arrow points out that the price is already outside the middle band. When it's outside then that means it is a start of an uptrend. Accumulate on the lows and on the dips to gain a good return on investment. This stock is more of a longer hold and needs patience is a virtue.

You can also ride on the momentum of this stock if you are a scalper or daytrader. How? You can check how fast these stocks is on the ticker how fast they are being bought, how many shares are being bought, how fast the price moves then it means this stock is on demand and is currently on momentum. Check if its near the low or if you are using heikin ashi for 1 minute then you can ride and throw fast once the heiken ashi for 1 minute turned red. Move faster cause after that the selling will become fast. Whatever type of trader you are you can profit from this kind of move if you know how to enter and exit.

Another type of play for this once are slow moving. Like MJC once you see it that someone is accumulating at the lows don't wait buy the ask cause no one will sell it to you at a discounted price especially for a huge gap play on the prices between bid and ask.

How will you know if it's for the long term or quickie? First you need to check the fundamentals. Is the stock undervalued? Yes. Long term. How about LMG that one is super overvalued what makes the price go up? The other one is there an existing gossip? If the answer is yes then it is also for long term until the stock hasn't release the news yet.

Based on my experiences these are the stocks which has gossip on it and went up in a great way.


APL a gossip that has been spread that this is a possible backdoor. Been halted then after that the news spread that JVDC confirmed that it will be their backdoor. What happened it opened at the highs and the usual sell the news happened. Now this stock is now at the lows too bad for those who bought the news though they are now stuck with a paper on their hands.


DAVIN the backdoor of Wendy's. Although the news of this one hasn't been confirmed yet then does that mean that DAVIN will still have a long way to go? Let's check where the pullback will lead us.

Why does other well-known companies buy these small companies? What is the reason for their buy back? The companies do this to avoid the hassle of IPO's. Buying a cheaper price company will save them lots of cost and effort for a cheaper price and voila they are now a PSE listed company on just a matter of some few bucks!

Monday, March 27, 2017

An interview with a ZFT basher

He is well known as a ZFT basher. He posts his port in the Zeefreaks Tribe page wherein he bashed the tribe for not maximizing their profit. Although not a fan of bashers cause I know how it feels to be bashed let's see where his bashing is coming from.


This is his port. He is a position trader of 1-2 mos in the stock market. First let's check if it is legit or not. Looking at the market value it is computed by current price multiply by number of shares and a multiplier of .99205. How did we arrive with .99205? It is 1 less the commission cost of .00795 then we will arrive at his market value. The profit is computed using market value less total cost. Although there is something wrong with the % profit due to technical errors of the platform we can still compute for the real average gain which is 3,424,658.88 over total cost of 9,164,455.63 for an average of 37.37%. Now that we have seen that this port is totally legit then we can now go through the interview so newbies will know what to do to profit from the market.

I gave him 10 questions most of the traders are curious about and this is how the interview goes:

Q.1. How much is you Starting Capital?

  • I started initially with 450,000 six years ago, then opened up another account using my business money with 5 million. I considered myself armed six years ago but lost 50% of that within six months. Paper loss they said but when emotions came, cut, cut, cut. Stopped for 3 months and entered again with 5 million on hand after doing notes during my off time, Parang lotto nag-aaral ng mga possible winning number lol para maka jackpot!
Q.2.3: Mistakes and learnings. How much is your total losses before you found your system?
  • Too many to mention. I was bullish on gold last year but didn't see G.Lo coming, my average then was around .22 good that it went up to .34 and waited, dropped a bit but still waited. Short story, I exited the position at .22 and never looked back. Profited a little bit also on DD with ave prices of 10 and exited when it was consolidating on 20, bought it at 22 got tied at it for a while and exited again when it consolidated on 35+ levels. DD was a buy on rumor, will reach 100 daw so sayang yun nabili ko nung 10 pesos haha. I'm bullish on DD that's why I bought on pullback, but that's just me. You guys do your homework :) So what I did there was locking profits too early and selling 100% of my positions. Having a mediocre allocations on a bagger stock is another lesson learned from me. At the same time I had a habit of going all in which was a poor decision because it left me tied to the stock when the trade went against me. Hoping is another. I missed a lot of opportunities when I went all in.
Q.4: System used and where you learned it?
  • Lesson learned have enabled me to come with my own system, its not absolute because you must have room for flexibility. Bottom fisher, support buyer, or sniper whatever you call it, it has worked for me. MA, candle patterns and RSI MACD lang gamit ko. The simple the better.
Q.5: How to build the proper discipline and mindset?
  • Learnings from 2&3. I'm not a 100% trader or what you say 9am - 3pm person. Sayang yung oras staring blankly on a computer screen. Boy Plunger died doing that.
Q.6.7: Do you have a mentor or do you believe in such?
  • Jack Schwager's Market Wizards. Boy Plunger. I don't believe in mentorships. There are only fund managers, inside traders or scammers. Pick a group you like. There are a lot of free information on the internet, you can start on the books that I mentioned and try doin virtual trading on your own. If you are looking for stock picks read your online broker's research and start from there.
Q.8: Advices you can give to aspiring traders.
  • Buy on supports during rumors. Sell on news or resistances whichever comes first. Filter the noise, cross reference if you must. Also never envy someone else's portfolio.
Q.9: I noticed you still have lots of buying power in your port. What's the reason for that?
  • Learnings from 2&3. There are times where I will miss a trade but I think its much better to wait holding your money than to wait holding nothing. No chasing. Ignore the noise or troll some :)
Q.10: Your Year To Date Annual return.
  • 2016 was net 250% up.


Thursday, March 23, 2017

Types of Traders and Investors

There are different types of traders. But only two types of investors that I know of.

1. Investor dahil nakulong.


  • These are investors who just jumped in a stock that they didn't even study. They bought at the peak and are waiting for the stocks to come back. Some stocks never comes back. Some will also come back. It is just a matter of time. But in stocks time is of the essence so you need to study whatever stock you are investing in. Some will ask you advices on what to do on their stocks. But the answer really lies within them. They just have to ask why they bought the stock. For what purpose did they buy the stocks. Do they really believe the company and the management of the stocks. If you can't answer it better cut that if you can't sleep at night and study first about fundamentals and technical analysis.
2. Investors sleeping on their gains.


  • These are investors who bought the dip and are just sleeping happily with their gains. This is the right type of investing and the right time where patience should be practice. If you know the companies' fundamentals and you think the price is still undervalued and if you analyzed the other businesses of the company owner and the owner thinks of his/her investors then they will share portion of the profits to you.
Types of traders:
There are actually 4 general types of traders but for the sake of other traders' opinions let's also include the others as just extension of the 4 types of traders.

1. Scalper: Scalpers are momentum traders who speculate in the price action of a stock. If he thinks this stock will rise he will enter and unload the stock in just a few flucs in a few hours. Usually they are into volume and earning just a little will already let them go out of the market. This is a little risky type of traders you need to have a great observation skills on price action and has a great understanding about the support and resistance before you enter a trade. You should not be too greedy and be happy with small gains. And you should always have a stoploss for this kind of trading if the direction of the trade is opposite from what you expected.

Cons: not maximizing the gains.

2. Day traders: Just like the scalpers, day traders also go to buy a stock where they can earn in just a day. They are also momentum traders looking for a stock that has great price action. They never held a stock overnight. They might jump from a series of stock that has great momentum after they come out of a trade. This type of trading style is somewhat exhausting. You need to watch the ticker all day if you can trade a stock or not. You should have fast executions and fast calculations on decision making. You should also have fast hands especially when the dumping time is next in line. This is a little bit on the risky side. If you want to know the risk of this one let's check SPM and LMG chart on how fast these big funds throw a single stock.

As we can see on this example this is where it all happen from the open of 3.95 it went as high of 4.8 until STARALL decided to sell it down to 3 pesos. The profit here has a high potential but can you act fast if shit happens. If the answer is yes then this is all for you. If not, then look for another type of trading that suits your style. We can also see that day trading loves the volatility of a certain stock. Greed should be tamed in this kind of trading and you will surely enjoy the profit. Also check for the volume of the stock, the bids for this stock just buy the first 3 volume that you can see on the bid so whenever you have to sell your stock you can still sell it. Don't buy so much you can't afford to sell on this kind of illiquid stocks.


LMG is one example wherein a selldown happened to. This one is much better than SPM since this one has bounce somewhere on its midtrend. This is also where daytraders jumps in the buy the bounce style. They hit and run and waited for another support and bounce. As always you should have fast reflexes on this type of trades. Trade just a minimal amount if you want to join the fun and if you want to learn this kinds of plays something you can afford to lose.

3. Position Traders: This are traders that look at the weekly or monthly chart. They prefer the buy and wait approach. More for sniping someone who buys at the dips or someone who waits for the support of a certain stock. Most position traders I know also knows fundamental analysis. They analyze the management of the stock, the earnings, the disclosures and once they have seen everything intact they wait for the right price. Here is the quote of one successful trader I respect, "Patience is not just for the appreciation of the price of your stock position, it is also used in waiting for the right time that stock hits the support and that is where we buy."


This is one of the positions of a position player of 1-2 mos. Let's check his stocks and where exactly did he buy his stocks. Let's check DD first.


Here we can see that DD is in a downtrend he didn't buy immediately. The lowest cost that DD has gone down on that time is 32 but his average is 37. So he might have waited for a confirmation and bought somewhere the box. Then he just sit and enjoyed his profits and still is currently waiting. Right now DD is on an uptrend consolidation trend.

Now lets check the second one which is RLT.


On this type of stock we can see that it is a different formation as DD. This one is forming its flag. He bought on the place somewhere between .56-.60 that's why his average price is .57 now the stock is running at .68-.70.

Last but not the least is X.


On this example he bought when he saw the sign of reversal when the first bullish candle appeared. You can also see that 7.08 is a strong support in the past and it is the second time that the price holds. We can see a strong support or strong resistance when it is tested so many times but the price is holding on that certain price but wait for the next day price action in the ticker if it became active then it's a signal to buy that stock.

4. Swing Trader: Swing traders are like the day traders and the scalp traders but they have a longer timeframe than the two but shorter than the position traders. As for the word swing they buy a stock until they hit their target price and look again for another opportunity in other stocks.


Sunday, March 19, 2017

People

People will also be one who can also pull you up in your trading skills. Just like how you spot a stock you also need to spot the right people who can build you up on your trading career. We filter people into two types the noise and the one that makes sense. Look for people who talk about strategies and are also sharing the indicators they are using. If you can relate with it and you find it easy to use then study it. If they thought you about some discipline and you know that is one of your mistakes in the past take note of it.

Building a group also helps especially if all of you are really interested in the market. Build a group with like minded individuals whose goals are the same as you. But make sure the discussions are only made before or after trading hours. When it's time for trading focus on it. Or if you are done with all of the planning and you have executed all your plans then you can come back and talk to them because nobody can already affect your decision making.

Characteristics to Spot a good mentor:
1. They talk about strategies instead of hyping a certain stock.
2. They talk about discipline. Buy low, sell high. Buy high, sell higher.
3. They encourage you and brings the best out of you.
4. They are happy with your success.
5. They talk about life and businesses.
6. They are positive people.
7. They are open minded.
8. They will listen to you on your bad trading days.
9. They will advise you on what you need to do.
10. They will advise you to be wary and cautious.

Saturday, March 18, 2017

Ticker Analysis

Ticker Analysis is used so that we will know the stocks that are in demand and the stocks that are being sold in the market. It is the way the market tells us if we are right with our researches and studies. Even if your fundamental analysis or your technical analysis is superb if the market doesn't agree with you then you might not profit from all of your analysis. This is our final confirmation to get our timing right.

Ticker analysis plays an important part in a traders' lives. We can see here how fast buyers buy a certain stock. What brokers buy the stock. How many quantity do they buy. How fast the transaction occurs. The direction the stock moves. If a stock is being bought out fast you can check what is the low of the stock for the day if it is still near the lows then you can buy it. The key is when a stock is being bought consecutively and is fast in nature purchase it on the ask side especially when its near the low for the day. Especially if that stock is one of the downtrend and suddenly bounced it is a chance for a dead cat bounce. One example I have with this is APX saw it moving fast at 1.81 and the price is getting higher and higher that I was able to purchase it at 1.9. It got a strong close at 2 and sold it in the morning at 2.19 it still went high up to 2.3 but it's still okay cause I followed my plan to sell in the morning. Another one is CHP bought at 8.3 sold on that day at 8.44.

Ticker plays can also be use to catch possible ceiling plays. When an unfamiliar stock comes out and it suddenly moves fast and you have seen that it is still low then go buy the asking price. No one will sell it to you at a bargain cause it is a long sleeping stock already. I was able to catch MJC on this one saw someone bought it at 2.05 too bad I think for so long and didn't buy 2.10 after someone bought it the price is now seen at 2.36 and I bought that one. The movement is so fast even the selling is fast on this one so you better act fast and don't be too greedy on this kind of plays. I got ipit on this because of my greed so that's one lesson learned for me. Good thing it still went up the 2nd time and I was able to sell it with a profit. It's better if you buy this type of stocks with just the minimum risk or just boardlots.

Ticker analysis can also show you unusual buying transactions with sleeping stocks. You can see if someone is accumulating something. List that stock check the charts. Check how it moves the past few days. Check the brokers buying on the previous days. Although the waiting for this kind of stocks are too long if you can wait for it then the possible return is also good. But just put a minimum amount for this kind of plays cause you don't want your money to be sleeping for too long. You can add up once more if this stocks have already move.

You can watch your ticker for the first 15-30 minutes. If you can't see anything then don't force yourself to trade. There will always be another day and another opportunity. Don't stare at your ticker too much after all the only important time in the market is the first 15 minutes the last 15 minutes before break and the last 15 minutes of the trading day. The rest are all noise.

Friday, March 17, 2017

Technicals

Charting can help us to build our system on when to buy and when to sell. Get the indicators you can understand well and can relate to in regards of your trading experience. Here are the set of charting tools I can easily understand when I look at them.

1. Bollinger bands: Set the period at 20 so that you can see the stocks breaking out from the MA 20.


Well from Learning yourself you know exactly who you are whether you are a pullback trader or momentum trader. In this chart you can see how Bhi broke out from the red colored line. That is MA 20. You can also see the blue bands spread out meaning an uptrend on this stock has already happened. Some traders wait for the break out so that they can be pretty sure that they will not have to wait for a long time. I bought at the support of .065 and sold it the other day at .073 I don't like selling when the sellers are already taking profit. I have slow hands I might sell at the bottom and let the others also profit from it they already push the price up after all. Whatever kind of trader you are you can see that you can profit if you bought the break out at the first day it rises the break out is at .066 if you will follow the middle band you still can profit if you sold at .75-.77.

2.) Guppy Multiple Moving Averages: This type of Charting uses various Moving averages to identify the trend. Here you can see the long term trend, the distribution, the accumulation, the reversal of the trend.


This is compose of short term Moving Averages to identify traders' activities. The color is the blue Moving averages composing of EMA 3, 5, 9, 11, 13, and 15. The other is for long term moving averages which identify investors' activities. The color is represented by the red lines composing of EMA 30, 35, 40, 45, 50, and 60. Finally for the confirmation of the trend we have MA 200 represented by the white line. When MA 200 is pointing up and is below the candles the trend is an uptrend. When MA 200 is pointing downward and is at the top of the prices the trend is down. When MA is straight it means the trend is in sideways and the stock is in the indecision mode. A break up or a break down is needed for confirmation.
The longer trendline is what we always follow as long as there is no signal for break in the trend is still our friend.

3. Aroon is one indicator to know the trend, the consolidation of the stocks and where the trend will change as well. I adapt this because of one purpose I always buy on the selling ranges. I am impulsive. I need an indicator that can control my impulses. Here there is a term called surge once reach stocks will consolidate again to get bwelo. If it is an uptrend stock we need to buy those dips so we can sell on those strengths once more.


Aroon up represents the bulls I chose green cause it is the color of the bulls. Aroon down is represented with orange the color of the bears. The thing to remember on this one is the crossing of the bullish aroon and the bearish aroon which happened on the first cross. 50 cross is a bullish cross in this case it crosses on the 53 aroon which is extremely bullish and a good buy. The parallel ones signifies consolidation. It is the indecision between buyers and sellers. For this one no crosses were made still the stock is on a bullish trend. Those indecision are also a good way to add volume to your stock. Volume is our key for a better profit opportunity. The selling opportunity comes when Aroon up is on it's surge That is the best time to lock in profits. Don't come back on the stock first while on consolidation level until a clear trend tells you other wise.

4. Alignment of the Stars and the Golden and death crosses

Alignment of the stars is composed of MA 20, 50 and 100. It is the MA's on the previous picture with Aroon indicator. Yellow is MA 20, green is MA 50 and purple for MA 100. If these 3 are aligned it represents the trend for the stock. Prices above the alignment are bullish trends.Prices below are bearish. Alignment of the stars is the alignment in proper order the shorter Moving averages should come first in an uptrend stock and vice versa for downtrend stocks.

Golden cross here is the crosses between ema 13 and MA 20. EMA 13 is represented by the teal color. Death cross happened when EMA 13 crosses down MA 20. Golden cross happened if MA 20 crosses down EMA 13. Death crosses are bearish. Golden Crosses are bullish.

5. Relative Strength Index (RSI) - This is too see if a stock is overbought or oversold level. This helps us in our decision making to buy, sell, hold, or to be wary or careful on a certain stock.


Here we can see that ALCO has an RSI of 94 already. At that range the stock is overbought already and is supposed to correct so it adviseable to sell already and be wary of the stock until you see a good price to buy it once more after the correction is made. After all the alignment of the stars is still intact.

6. Price Exhaust: I use this to see whether buyers are strong and sellers are thinning. When buyers are strong that's the moment I sell. When sellers are thinning that's the moment we buy.


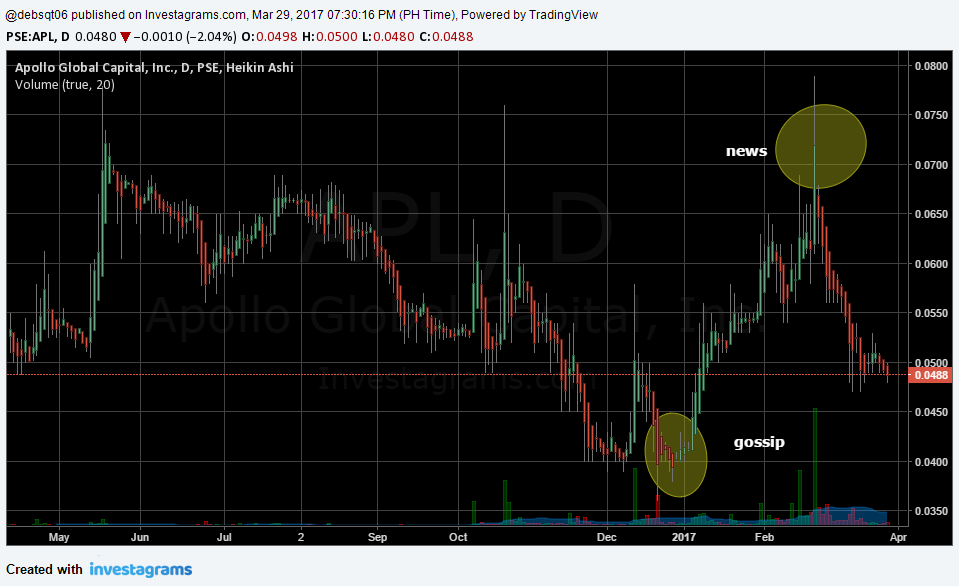
7. Heikin Ashi Candles: The candles I use to see where to buy or sell Once a red candle shows up on an uptrend stage that is the time you need to sell. When a green candle starts appearing in a downtrend stage that is the time to buy. But then I don't wait for a red candle to appear. I sell once buyer is still buying the stock. Selling on the first red you see is actually chaotic. Sellers are already racing to still lock profits at the top especially if you are holding an illiquid stock. And I don't wait for the first green I check the stability of the price and if it holds I already buy it. I may buy some tranche on the ask side price and the other tranche is for the real support of the stock and wait until it get hit.


In determining the real trend I put together Bollinger, Guppy, Golden Crosses, Alignment of the stars. They look like this.


If you can't analyze it together just put them separately. I just put them together to save time. I separate the Aroon, Price exhaust and RSI cause they are making the picture small. There are still lots of indicators out there but these are the indicators that fits and controls me and make my buying and selling systematized than before. Find out what indicators fits you the most and can make a profit out of it.

Tuesday, March 14, 2017

Fundamentals vs. Technicals

First I started as a fundamentalist since I am a CPA. You see when looking for a company you need to know the background, the valuations, the business and the management. We are looking for a business that will let us sit tight until it ripens and we can take profit from it. Fundamentals is just easy to do since there are lots of information available to the investors nowadays. I get my info from pse.com.ph and edge for financial report.

What are the information that we need to take into account so that we can know the company better and how can we make use of it?

1. Market Capital: Here we can segregate the stocks whether they are small caps, medium caps or big caps.

  • Small Caps: These are small businesses that has a market capitalization of less than 20 billion. They are well known basura stocks that can easily be manipulated. These stocks just move once in a while so when you see it moving you can either play a boardlot with it or 2. They are high risk high return in nature. This is only used to satiate your greed and if you are one who wants to jump in every action there is in the market.

  • Medium Caps: These are businesses that has atleast 40billion up to 100 billion in Market capital. They are also known as growth stocks and has the chance to be included in the index especially if they are performing well in their respective business.

  • Big Caps: Also known as the blue chips. They are companies with more than 100 billion market cap. They are already well-established and are the one that composed our PSE index. 
Although they are big it doesn't hinder them from risk as well as stocks are cyclable in nature. It goes up and down on whatever circumstance we are in.

2. Income Statement: We can check how the company is performing in edge.pse.com. To see if the company is profitable check their 3 year earnings if it is increasing or not. Also ask yourself if that business will still be profitable 10 years after. In businesses there are lots of threats that can exist for example the communication industry can have threats because of free platform communications that has now existed like facebook, viber, and some social sites. Before TEL is a very profitable business. Everyone needs to connect with their friends through landline. Now you can connect with them through messenger and it's free. Of course people will always choose the free ones.

3. Statement of Assets and liabilities: Check the assets of the company to see if they are expanding. Check also their liabilities if it is decreasing. Their Assets must be greater than their liabilities. You don't want to invest just so they can use your money to pay the companies' debts.

4. Book to Market Value: Book Value / Market Value. This is to know whether a stock is undervalued or not. The higher it is the more undervalued the shares are. Stocks below book to market value are the overvalued ones. Most blue chips have a book to market of less than .50. It doesn't mean that they are not a good investment but demand for them is to high that it sustain the price.

5. Price/Earnings Ratio: Price earnings ratio is also available on pse.com.ph you just need to list it on the side of your stock. Compare it on the other with the same industry. The lower the EPS the better. Rate it and get the top 3. And invest on it.

6. Management: We need to know who the owner of the company is. Their character and integrity. Are they good managers. Are the businesses that they are holding successful. If this is an IPO you can also base your decisions on this one. Also if you want a long term stock base your decisions with this one as well.

7. Debt over Equity Ratio: These is computed as Total Liabilities / Total Equities. The lower the percentage the better.

8. Free float: Here we can see if the company is going to be dissolved or not. You can also see here the easily manipulated stocks. If a stock that is sleeping suddenly woke up you can play it with just a minimal percentage of your port since it is hard to dispose of such. You need to sell it when buyers are still demanding it and sellers are still waiting for them to get tired of buying. We should always be out before those big sellers can sell down the stocks. Just look at the current SPM and LMG type where in they dump loads of these basuras while people are still buying the hype!

9. Dividend Growth: You can check how much and when the stocks gives their dividends so you can also do some dividend play. Some stocks even if they give dividends doesn't go down in value especially if they just came from a downtrend and has reversed. Like MER last year it gave dividends and still the stock rises to 350 from its low of 245 that time. Also ALCO which is on an uptrend gave stocks but the price never falls that much and rises again. Another is PLC which is also just found its bottom and is on its uptrend. You will have income both on the dividend plus the price appreciation of your stocks. Also foreigns love investing on companies that gives dividends that is one of their requirement on investing on small caps companies here in the Philippines.


This is my fundamental research on 2014. Here we can see that ALCO is undervalued and the EPS is rank 3rd on its industry. Also BLFI which ranks 2nd on its industry and also one of the undervalued as well. If you invest there in 2014 and you can see that the price runs just as low as .1842-.245 then you might 7600% richer now. also BLFI with a price of 1.32-2.42 and now it's currently at 4 pesos you are now 300% richer. But if you can't wait and you want to time it. You can go look at it using technicals.

Fundamentals takes time to do. I usually finish it after 3 weeks of compilation. Sometimes I do it at my free time on December and continues it after I went back home from vacation. After neglecting fundamentals and studying the technicals of the market I realized that it's good to connect the two. Sitting on the right stocks on the right time and on the right trend is the key to make you richer. It is the quality of the trade that is more important than the quantity of the trade. Traders and investors who have the right system, the right mindset, and the proper discipline will always have the edge.

Experience is the best teacher

To truly know yourself you need to feel the actual happenings in the market. Your winners and losers define your strengths and weaknesses. Separate your winners from your losers and from there you can see which strategy works for you and which does not. You can retain your strengths and eliminate your weaknesses or polish it. Analyze where you got it wrong. Is it the timing, the stock picking, is it from the bias of a certain stock you hold, or wrong position sizing, or just the impulse from buying what you see is winning?

Most of my prior mistake comes from timing, impulsive trading, overtrading and overleveraging. If you know your mistakes then you need to find solutions from your actions. Hope is not a strategy cause once you hope you might wake up finding yourself more in trouble because of higher losses. You need to accept that losses are part of the game. When you have a mistake in timing you cut first and observe what happens to that stock. Ask where the trend is. The support and resistances of the stock. Observe the demand and supply for that stock. If it is on an uptrend a stock that is losing might just be on a phase of a healthy pullback or on its consolidation mode. If you studied the fundamentals of the stock and you have seen it as undervalued you can either buy on those pullbacks to gain volume. Volume is what a winning stock needs. What I do is buy the pullbacks and sell the strength. You also need to look for indicators you truly understand and is easy to use and can put up with your previous learnings.


I use Guppy Multiple Moving Averages to know where the trend is headed. I also look at the longer timeframe to see if the stock is good to hold or not. I use Heiken Ashi to know the direction of the price action. In the heiken ashi we sell on the first red we see but I prefer to sell where the stock is the strongest and still has lots of buyer cause when you sell on the first red there is where most traders are already selling their shares too and you will race who has the fastest hands among all of you.
The blue arrows are for buying and the red arrows are where we sell. So in this indicator we can also see that stocks have a period of consolidation where Minervini said is bwelo. You can find it on the boxes and can also be called Darvas box. After the consolidation we can see it enter a new high as well. Currently we are in a period of consolidation once more. This system also teach you about golden crosses for ma 13 which is the teal color and MA 20. You can also find here the Allignment of the Stars presented by MA 20 which is the middle band of the bollinger and is in color yellow, MA 50 the purple color MA, and MA 100 the green colored MA.

For other discipline purposes, I also use Aroon in determining the trend and the consolidation process. Aroon says that stocks don't go in one direction, price surges and it needs to rest the reason why we have correction, consolidation, and healthy pullback. RSI to know the status of overbought and oversold levels. Price exhaust to see how the buying and sellling are already thinning or thickening.


Another mistakes we also commit is buying from impulses. It is the Fear Of Missing Out ones trade. You enter at the highs not knowing that traders are already locking in profits making you one of the investors of the stock because of high losses. It's okay to watch the winners especially if it has an unusual volume. After watching it wait for the period of consolidation first. Make a research on the fundamentals of the company while waiting for the consolidations. Look for answer why this stocks go up. Is there a gossip on a certain stock? If there is then it's good to position on that stock until the news comes out. Just like what happened to APL it is a classic example of buy the gossip sell the news. After the news came out it went to a high of . 77 and was sold down to .61. You can either play the bounce on that one but then don't come back already. Especially that the news is out already there will be no more catalyst to make this stock higher.

Monday, March 13, 2017

Knowing Yourself

The first step on your way to investing and trading is to know yourself first. In trading our greatest enemy or our greatest foe is ourselves! Will you be a friend or a foe. Are you equip with the right mindset, the discipline on your buying or selling? Are you more of a risk taker or are you one of the playing safe. What are the things we should know about ourselves first?

1.) Time frame: How long can you wait. Are you patient or impatient. Here we need to practice patience. Even if it is a blue chip, a second liner, a 3rd liner, or a sleeping stocks everything is by patience. Here is where you will see if you lie on the investor side or the traders side. Traders are more about price action and short term of time. They can settle for days, weeks or some months for position traders. Investors on the other hand just sit on their fundamentally sound stock and buy on dips.

2.) Risk Take: Are you the type who can risk too much and play basura stocks for easy money. Or your more of the safe one. The truth is there is no zero risk in stocks. Even blue chips go down by 50% like TEL, SMC, CEB and other blue chips when the cycle comes. You just have to have the proper mindset on what you enter. If you are an investor on blue chips and when the bear cycle comes and it hits your pet what is your reaction? Are you bothered? Are you one of those posting their portfolios in the groups looking for answers. Maybe the answer to that is you chose a different discipline because the truth is you really are not an investor but was just influenced to be an investor because of a book you read, a person you look up to, or was just a mere follower of an investors' group. Actually if you really are an investor and you know the company fundamentally and you know the cycle you will be pleased with how low the stocks fall. PSEi don't fall on the same time. As for my observation the most beaten stocks are the one with the highest upside. Let's sell SMC from 45 it went to a high of 100. Easy 100%. You just have to know where these stocks fall and you can just sleep over them. For traders of course cut loss is your friend especially if you are one who goes to high risk high reward stocks.

3.) Discipline: Are you in control of your trade or you are the implulsive type? Do you make a plan or review the stocks before you enter. Do you have all the elements before you enter a stock like stoploss point, entry price and target price? Do you list the supports and resistances of the stocks beside it on a piece of paper before you enter a trade. Do you just buy the dips or buy the break outs. I am more of the buy the dips person cause when I tried the buy the breakout I lose more especially on an illiquid stock that suddenly become liquid. As my friend said you just buy the support if you won't be given then just leave it be. You shouldn't have the fear of missing out mindset. Just follow the plan and you will be safe.

4.) System: In trading and investing you should have a system on when to buy or sell depending on your own strategy. Don't look for answers around you. Every traders will give you different answer that is why the market price is not consistent and is very volatile. Everyone has their own beliefs. No one really has the right answer. The only one that can answer us is market itself. Develop your own system. It might come from your trading experiences. Your losses or your gains. Review them and see your strength and weaknesses. Where do you win most of the time? Focus on that. Where do you lose most of the time? Avoid that. Always ask yourself where you made a mistake. Is it the timing, is is the stock picking, or other things that can contribute to your mistakes. Whatever it is you should know how to point it out. If you can't point it out then you wasted another tuition that you lose in your past trades.